
See every resource. Know how it is behaving.
Every compartment and region swept read-only, each resource enriched with its relationships, history, health and cost. Live metrics every five minutes between full collections, with alerts that do not cry wolf.
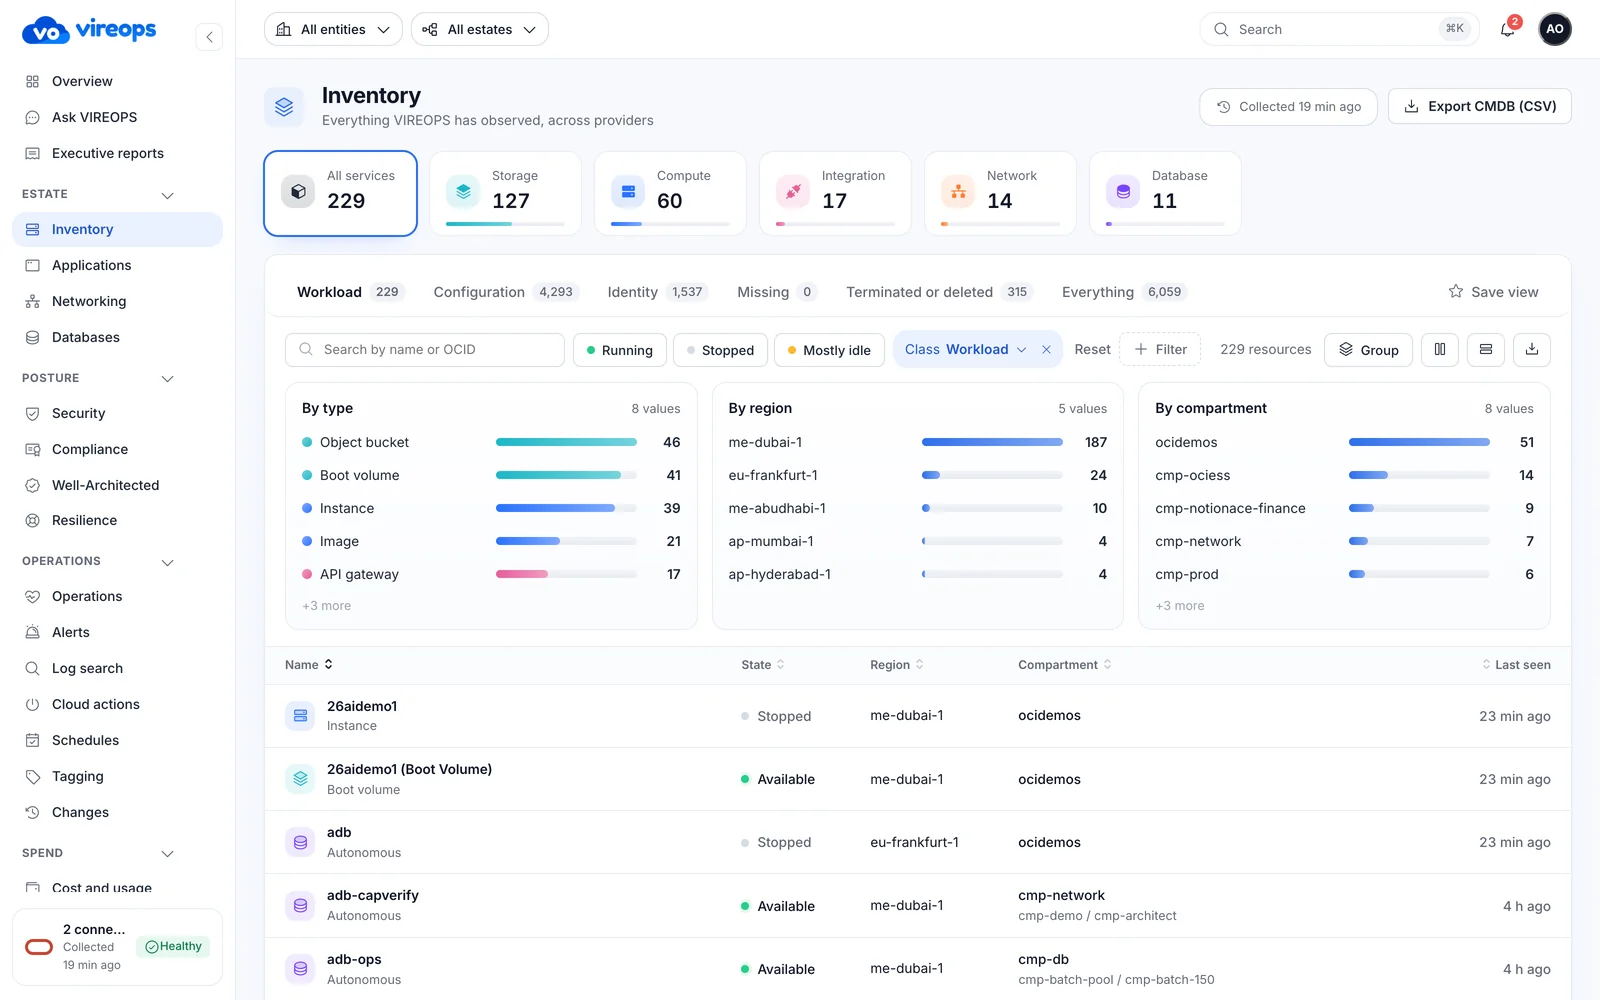
Know every asset and its story
VIREOPS sweeps every compartment and region through OCI Resource Search, plus the types Search misses, then enriches each resource with its details and relationships.
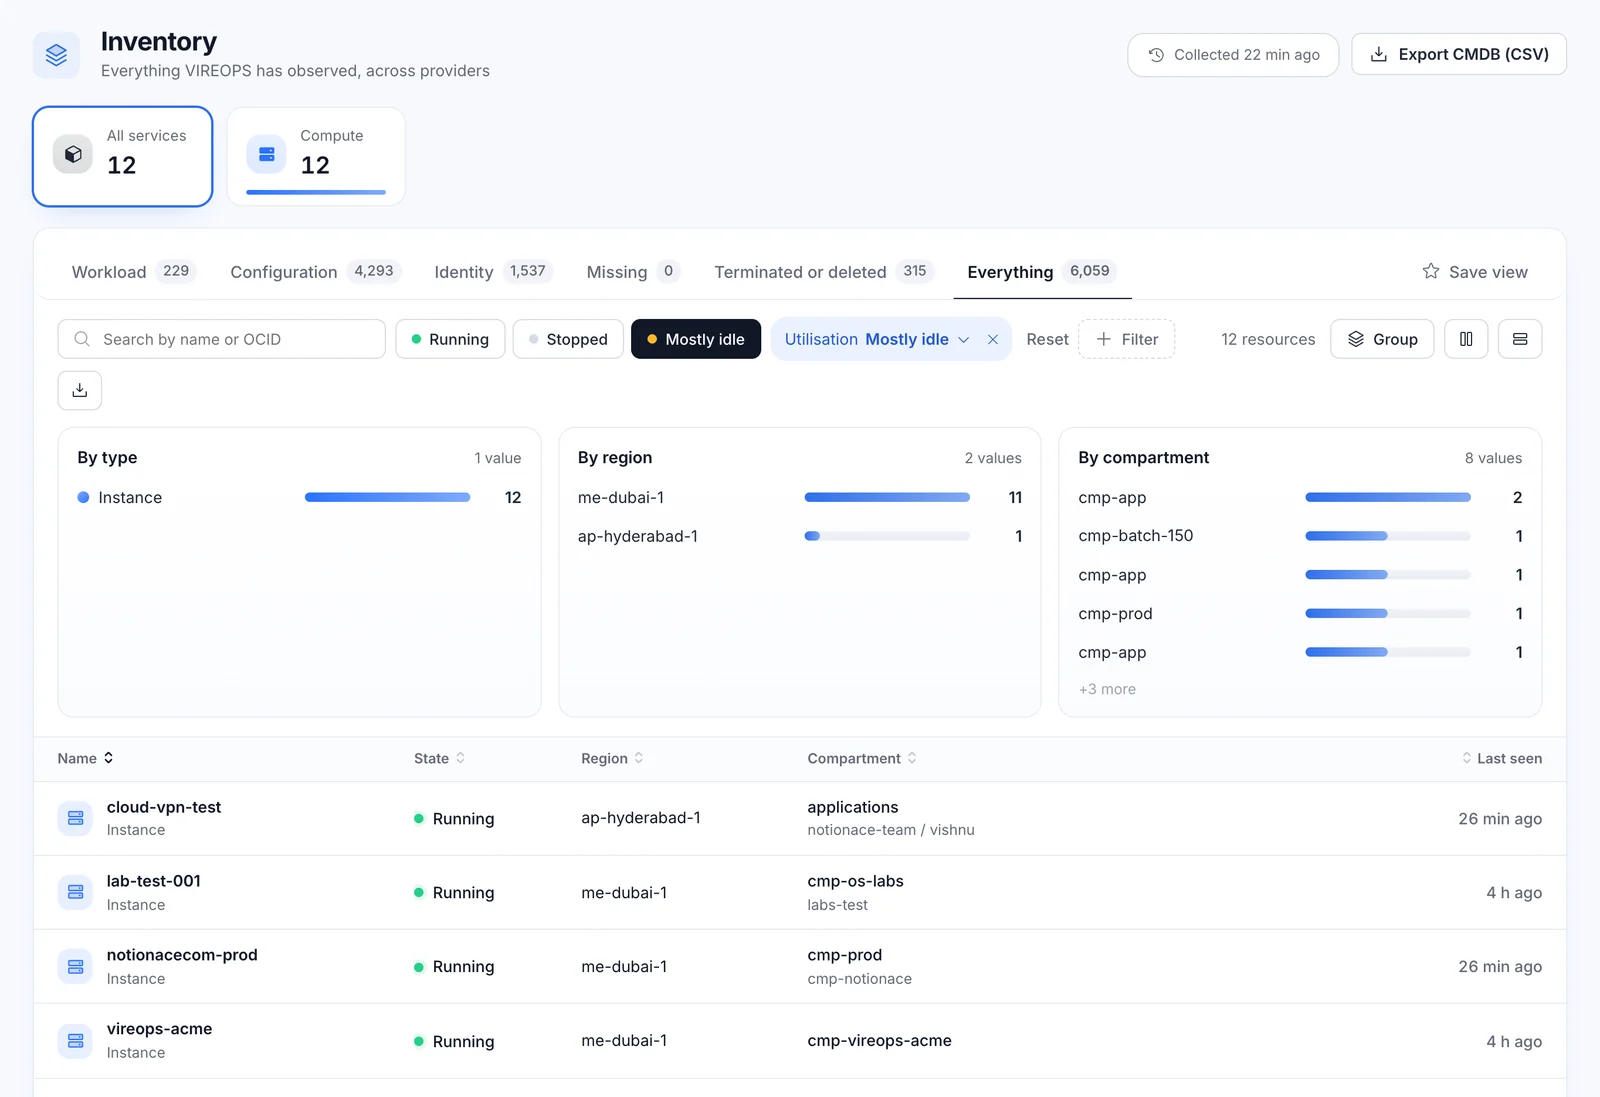
- Service tiles, saved views, grouping, state dots and compartment paths
- A Mostly idle quick filter that counts idle instances exactly as Optimize does
- A data table that scales to thousands of rows
- CMDB CSV export, audited, with formula cells escaped so it is safe in spreadsheets
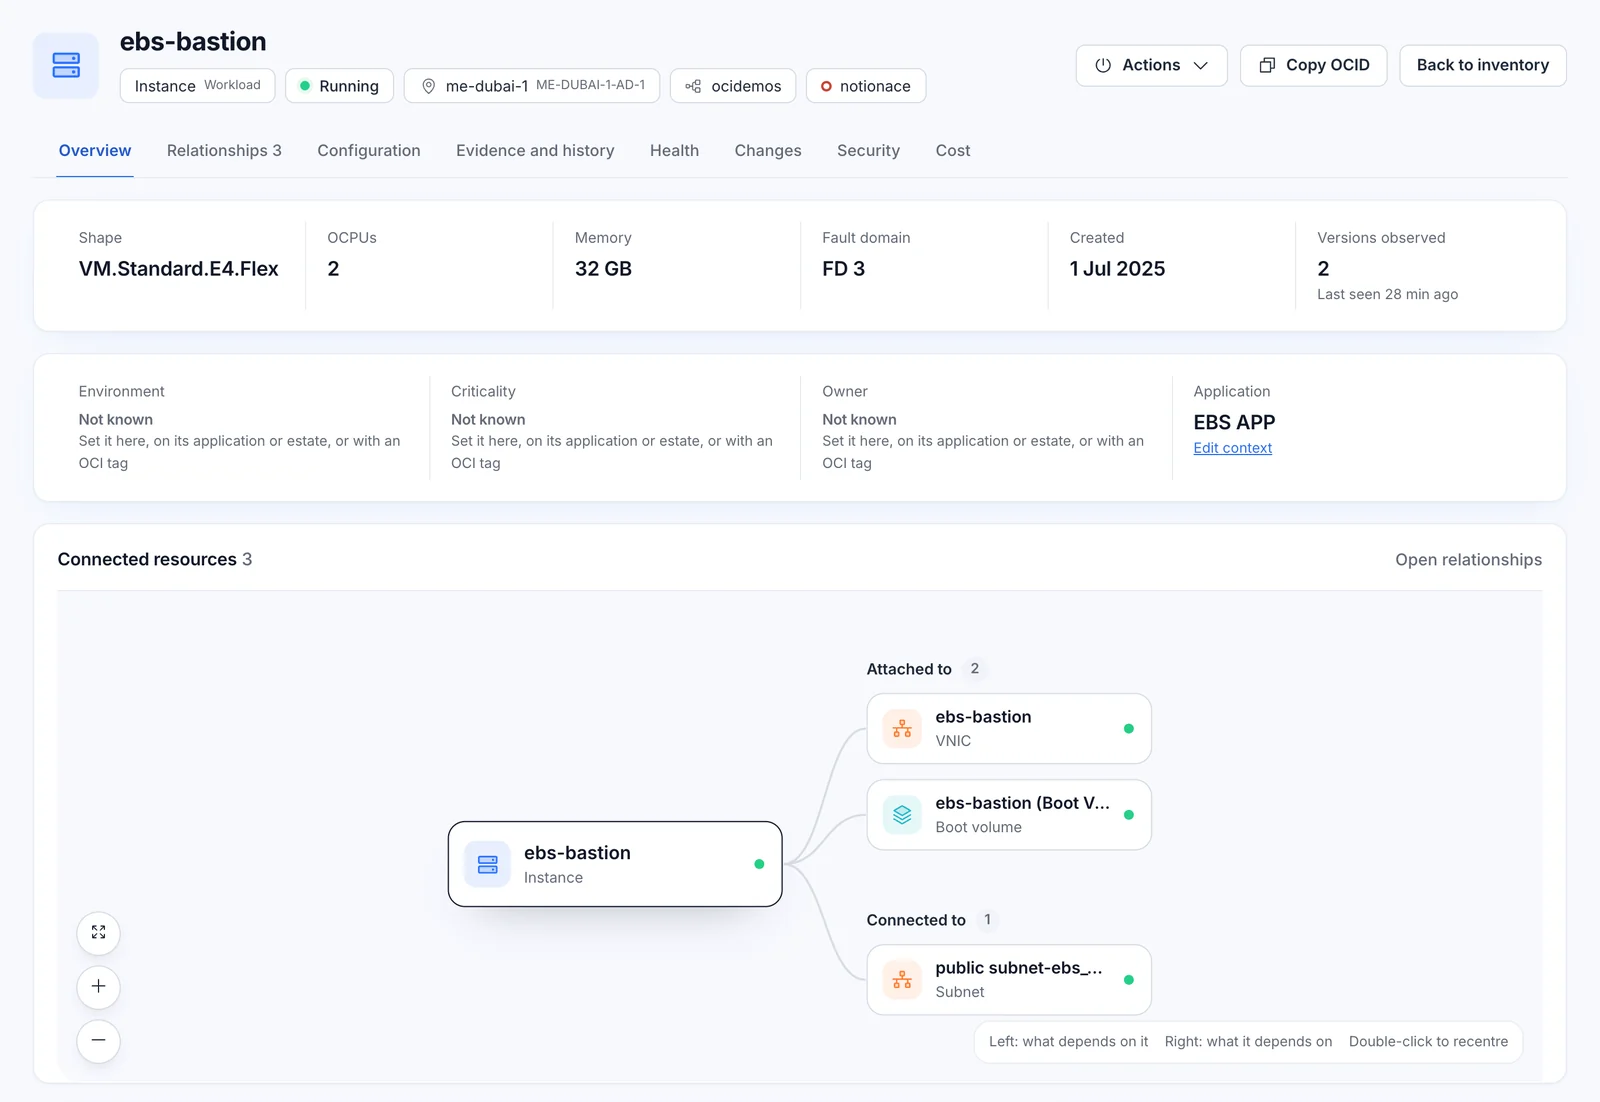
One page for everything about one resource
Key facts and a relationship map one or two hops out, with tabs for health, changes, security, cost, relationships and the raw evidence.
- Daily CPU and memory charts, plus a "Last 24 hours" five-minute chart per unit
- Native profiles for Autonomous Database and DB System
- Service context (environment, criticality, owner) and where each value came from
- Renames keep the same asset. Evidence is stored with a SHA-256 and nothing is hard-deleted
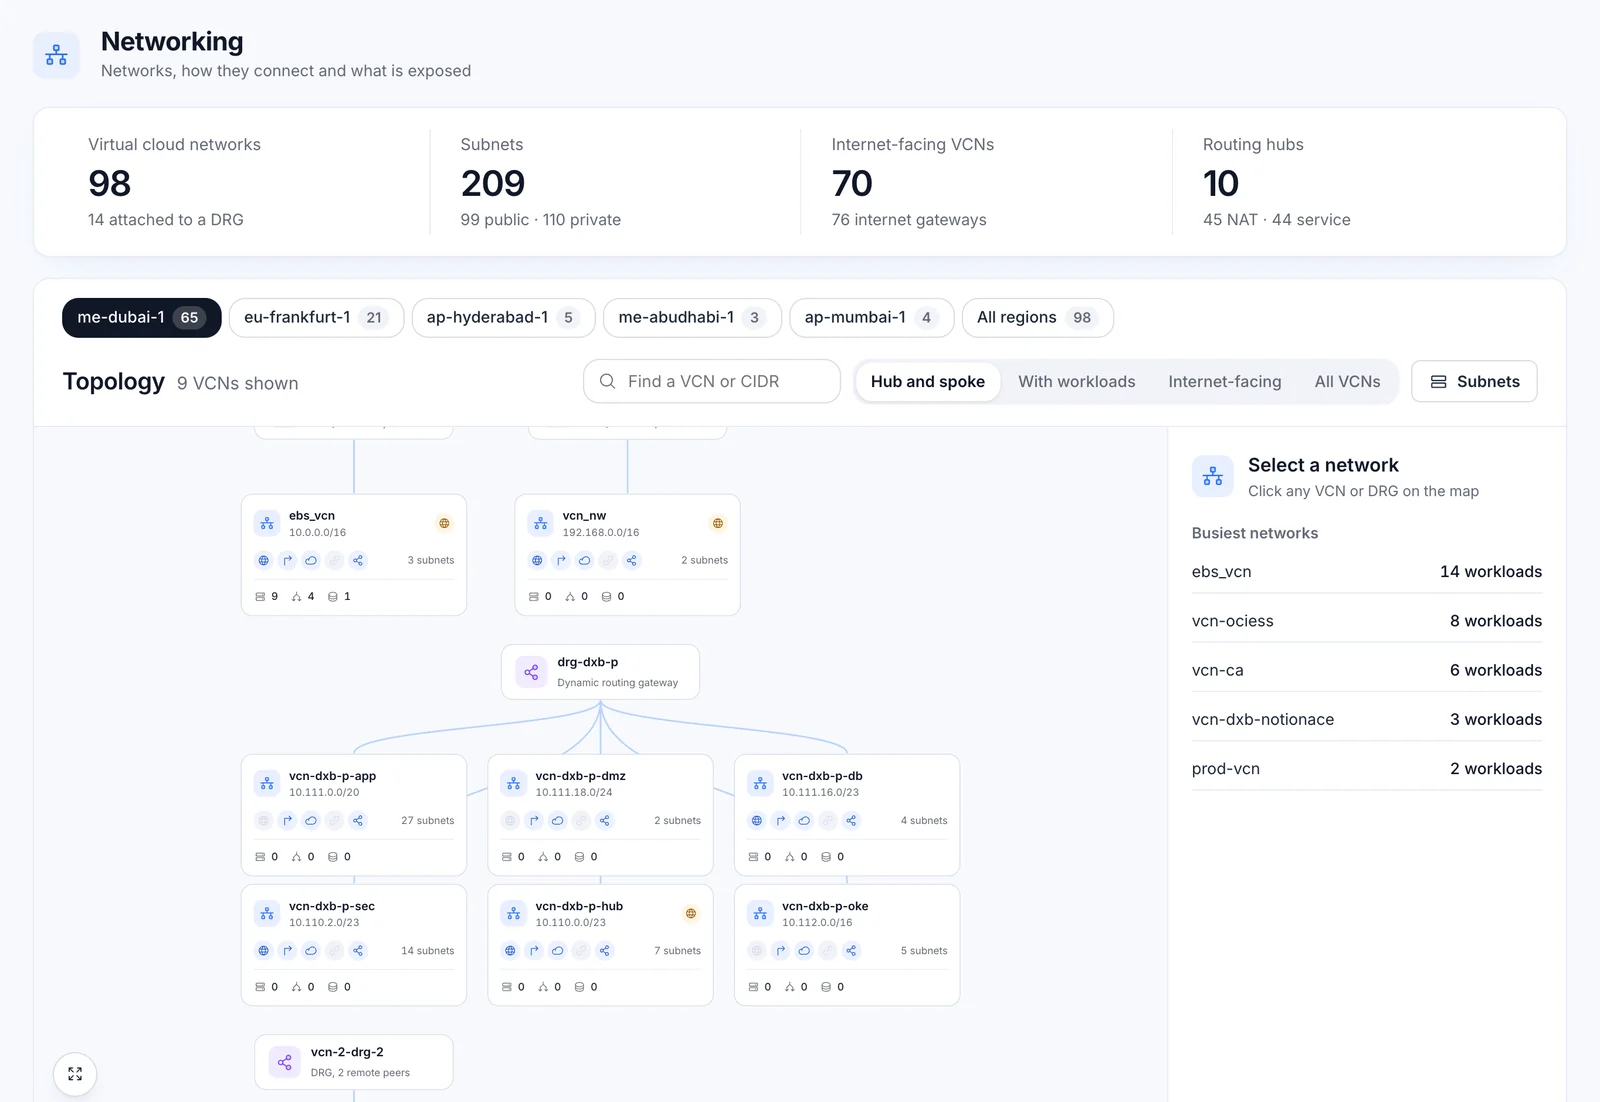
See how everything connects
Applications and networks are mapped from observed facts, not drawings. The network map is clickable, shows names on hover and draws cross-region DRG peering.
- Applications grouped from load balancer backends and app tags, in tiers from internet to entry, app and data
- Suggestions come only from observed facts; you curate the final group
- Estates with rule-based membership; each connection shows its capability table and collection runs
Five-minute metrics between full collections
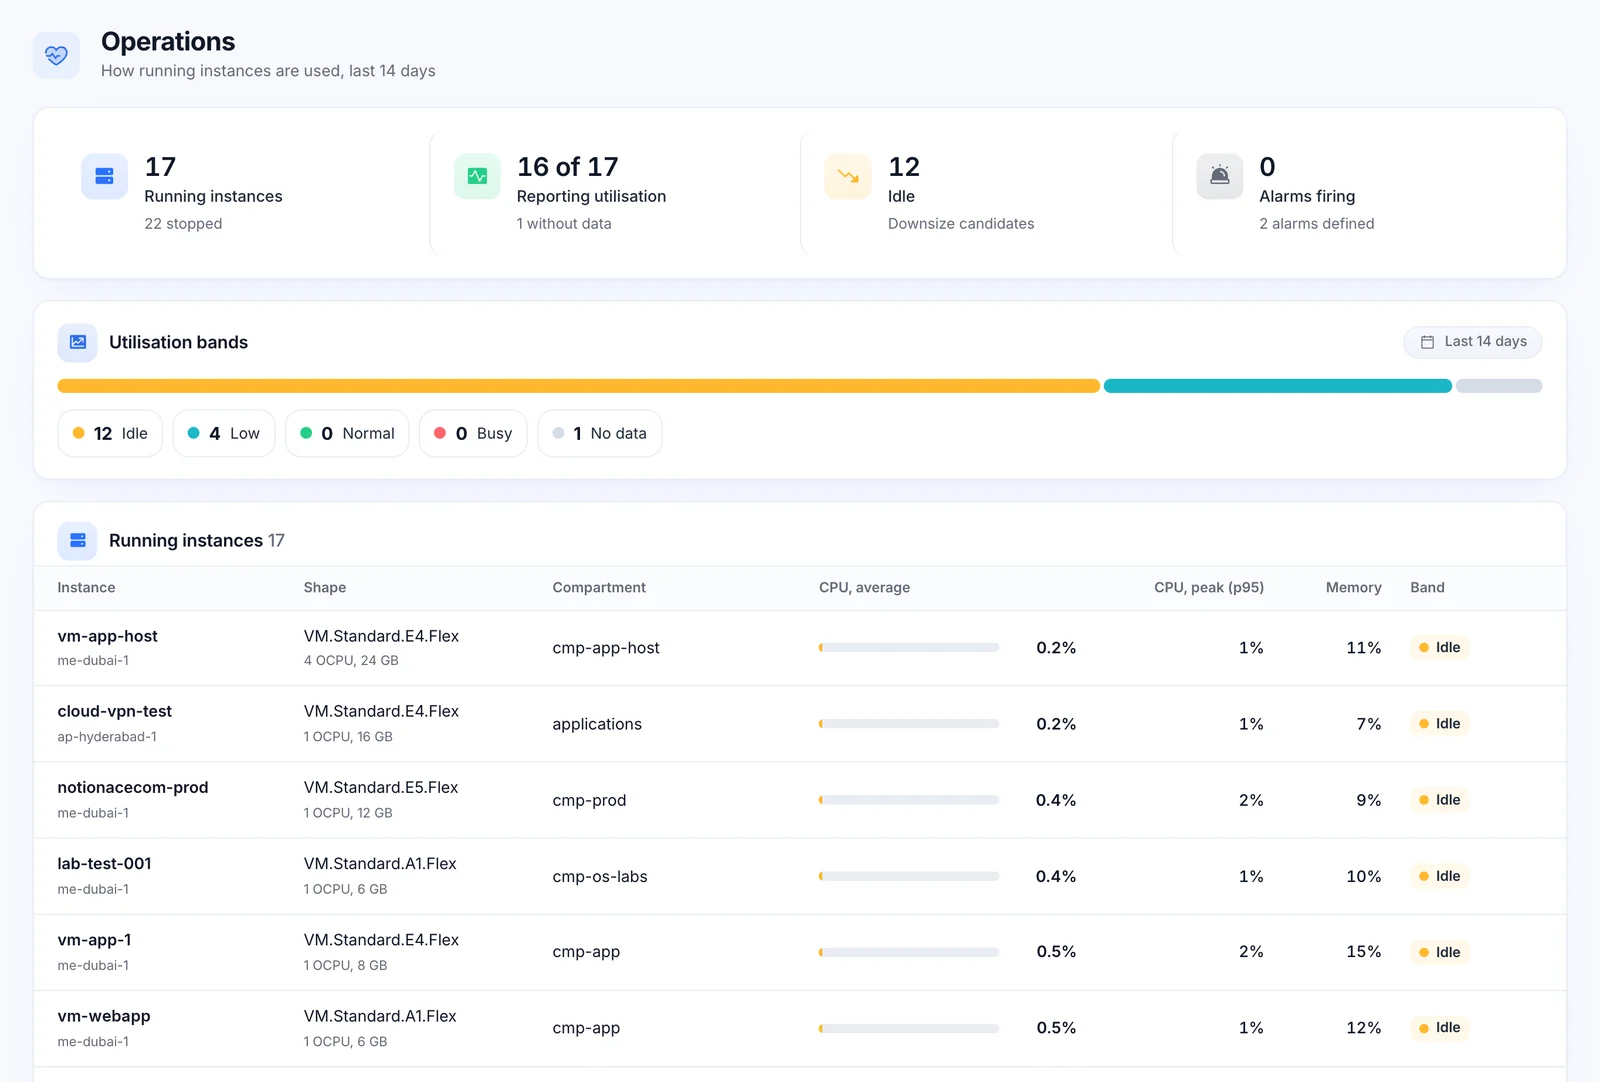
Live metrics are read from OCI Monitoring every five minutes and kept for eight days. Operations places instances in utilisation bands with CPU and memory, lists alarms with firing ones first, and shows collection health.
- Instances: CPU, memory and OCI infrastructure health
- Autonomous Database: CPU, storage, sessions, blocking sessions, queued statements, query latency, failed logons
- OCI PostgreSQL: CPU, memory, connections, blocked queries, deadlocks, long queries
- Load balancers and volumes: unhealthy backends, 5xx, response time, throttled I/O
Alerts that do not cry wolf
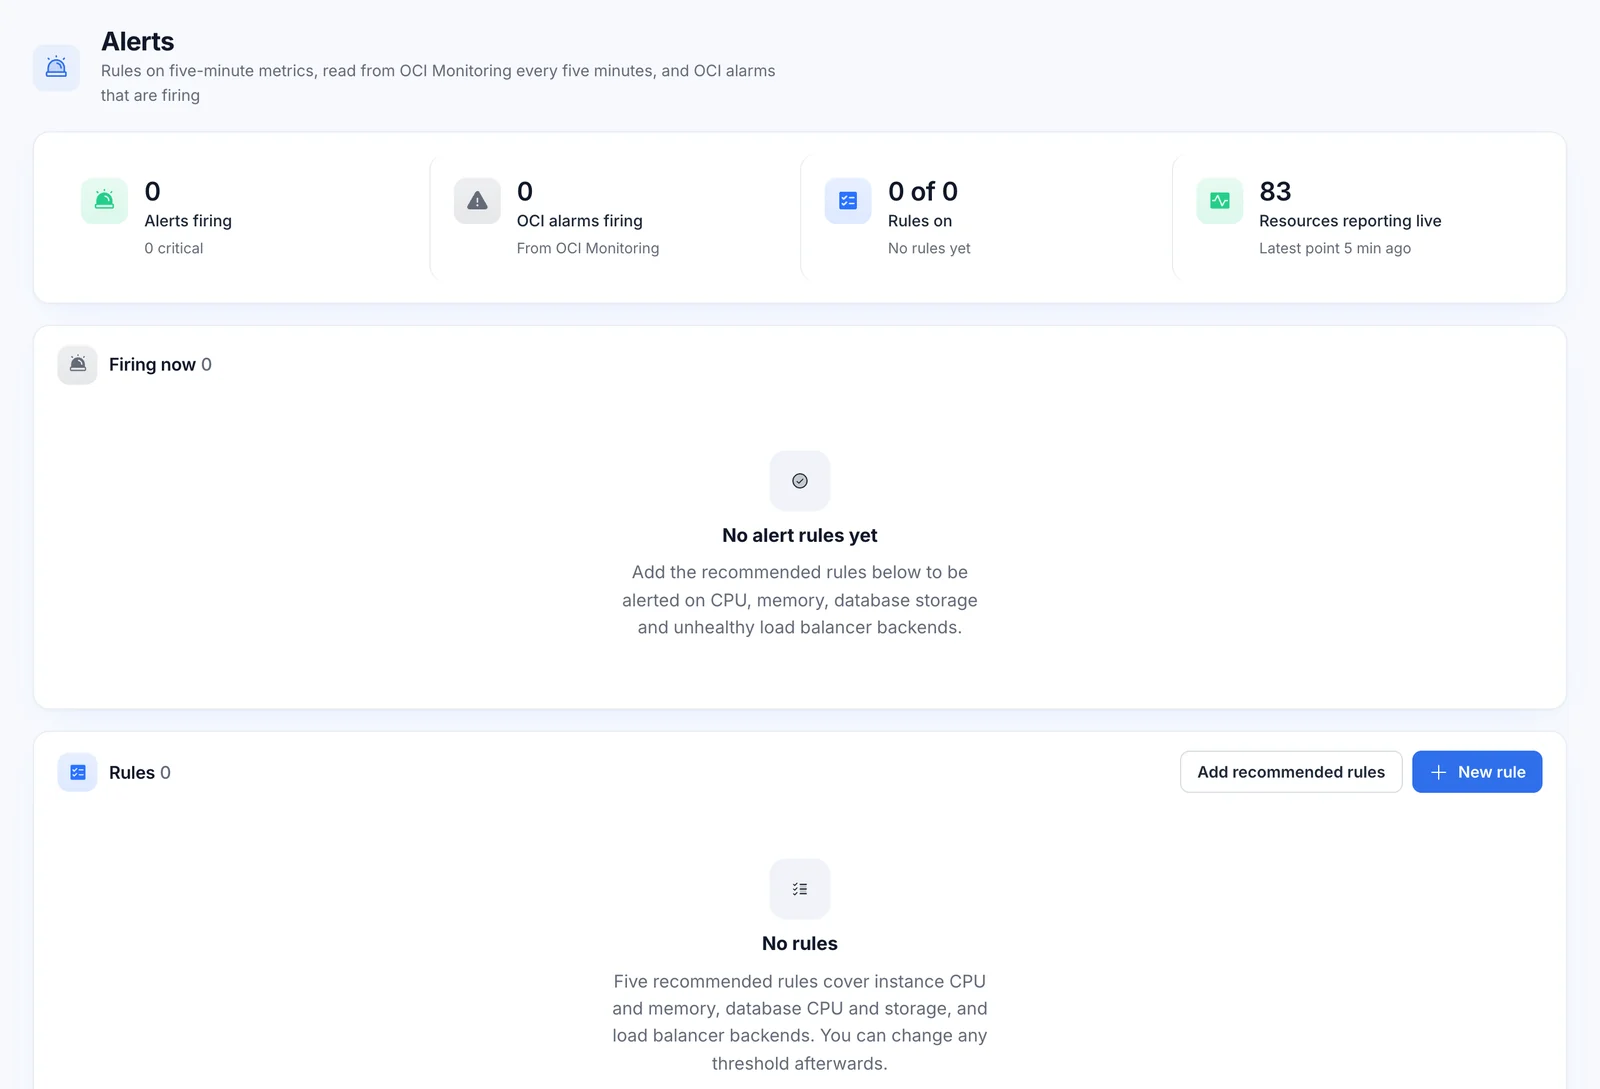
Rules take the form "metric above or below a threshold for N minutes", at warning or critical, per resource kind. An alert fires only when every point in its window breaches, and missing data never opens or closes one.
Nine recommended rules, added in one click. Firing alerts, OCI alarms, the last seven days resolved and live coverage sit on one screen.
Search the audit log and every OCI log in scope
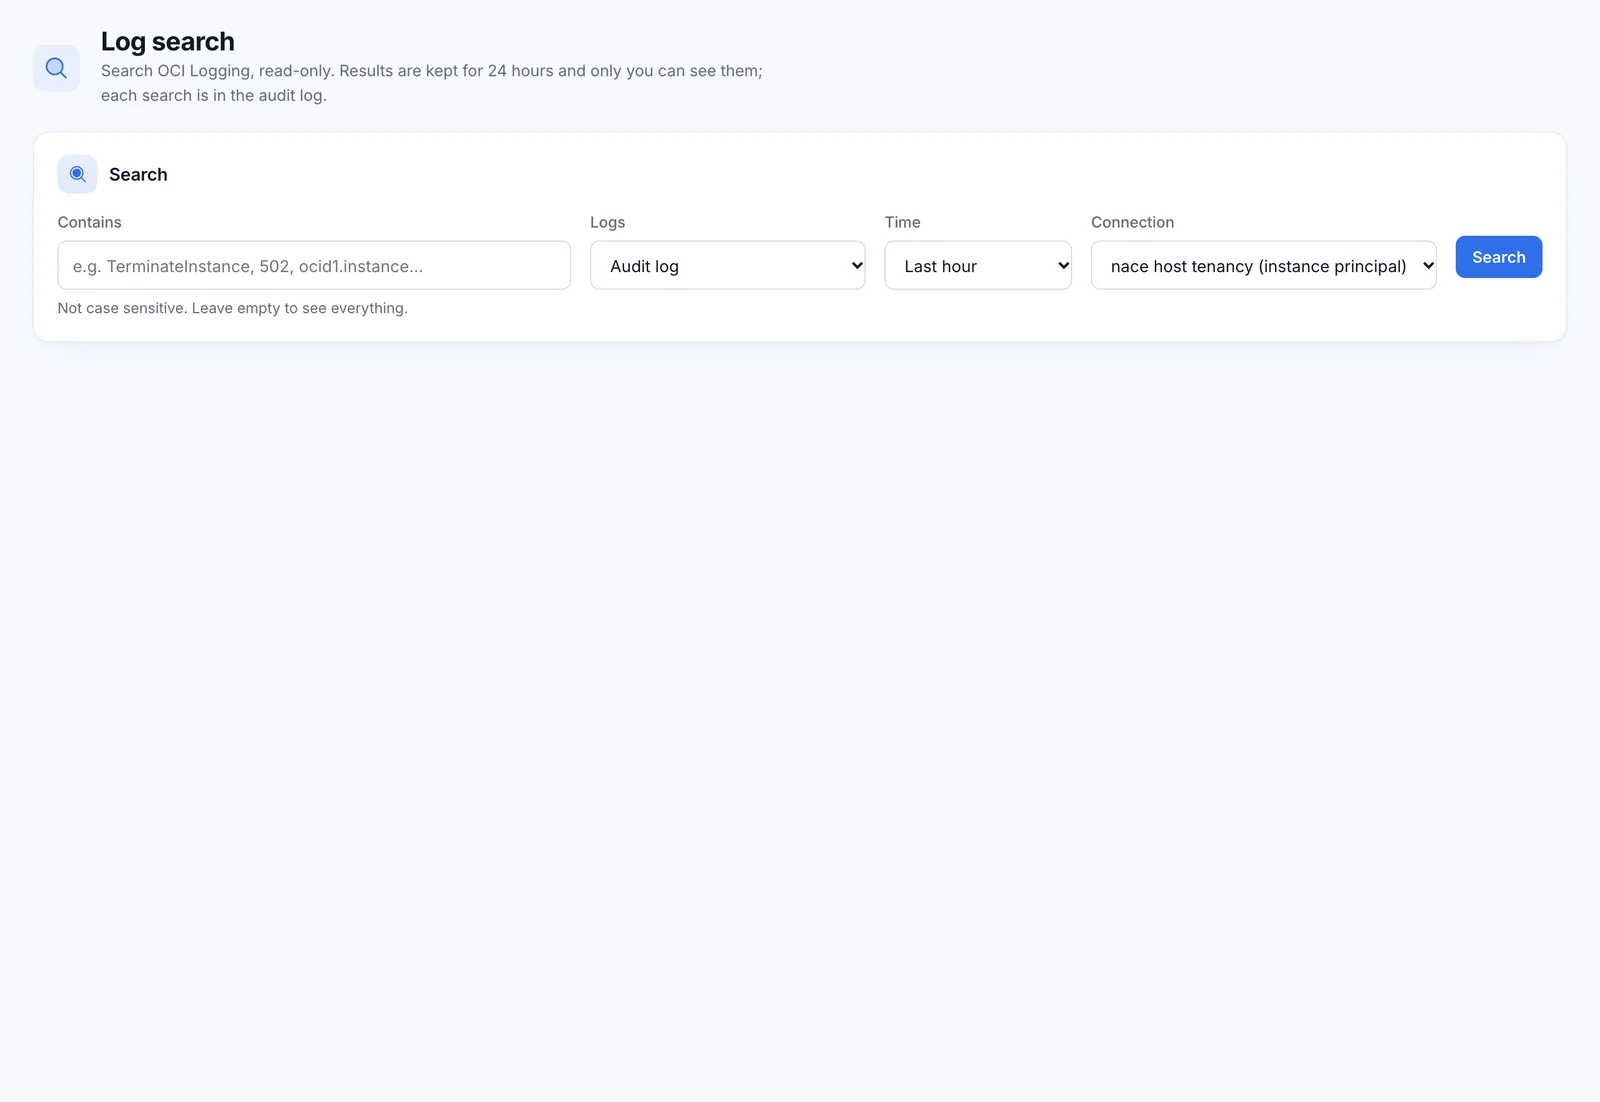
Search 1 hour to 7 days back, with optional text. VIREOPS writes the query, so the search text is only ever matched and cannot reach outside the connection's scope.
- Results kept 24 hours, private to the person who searched
- Every search is audited and needs the log.read permission
- Service and custom logs need the read log-content grant on the collection policy
Who changed production last night?
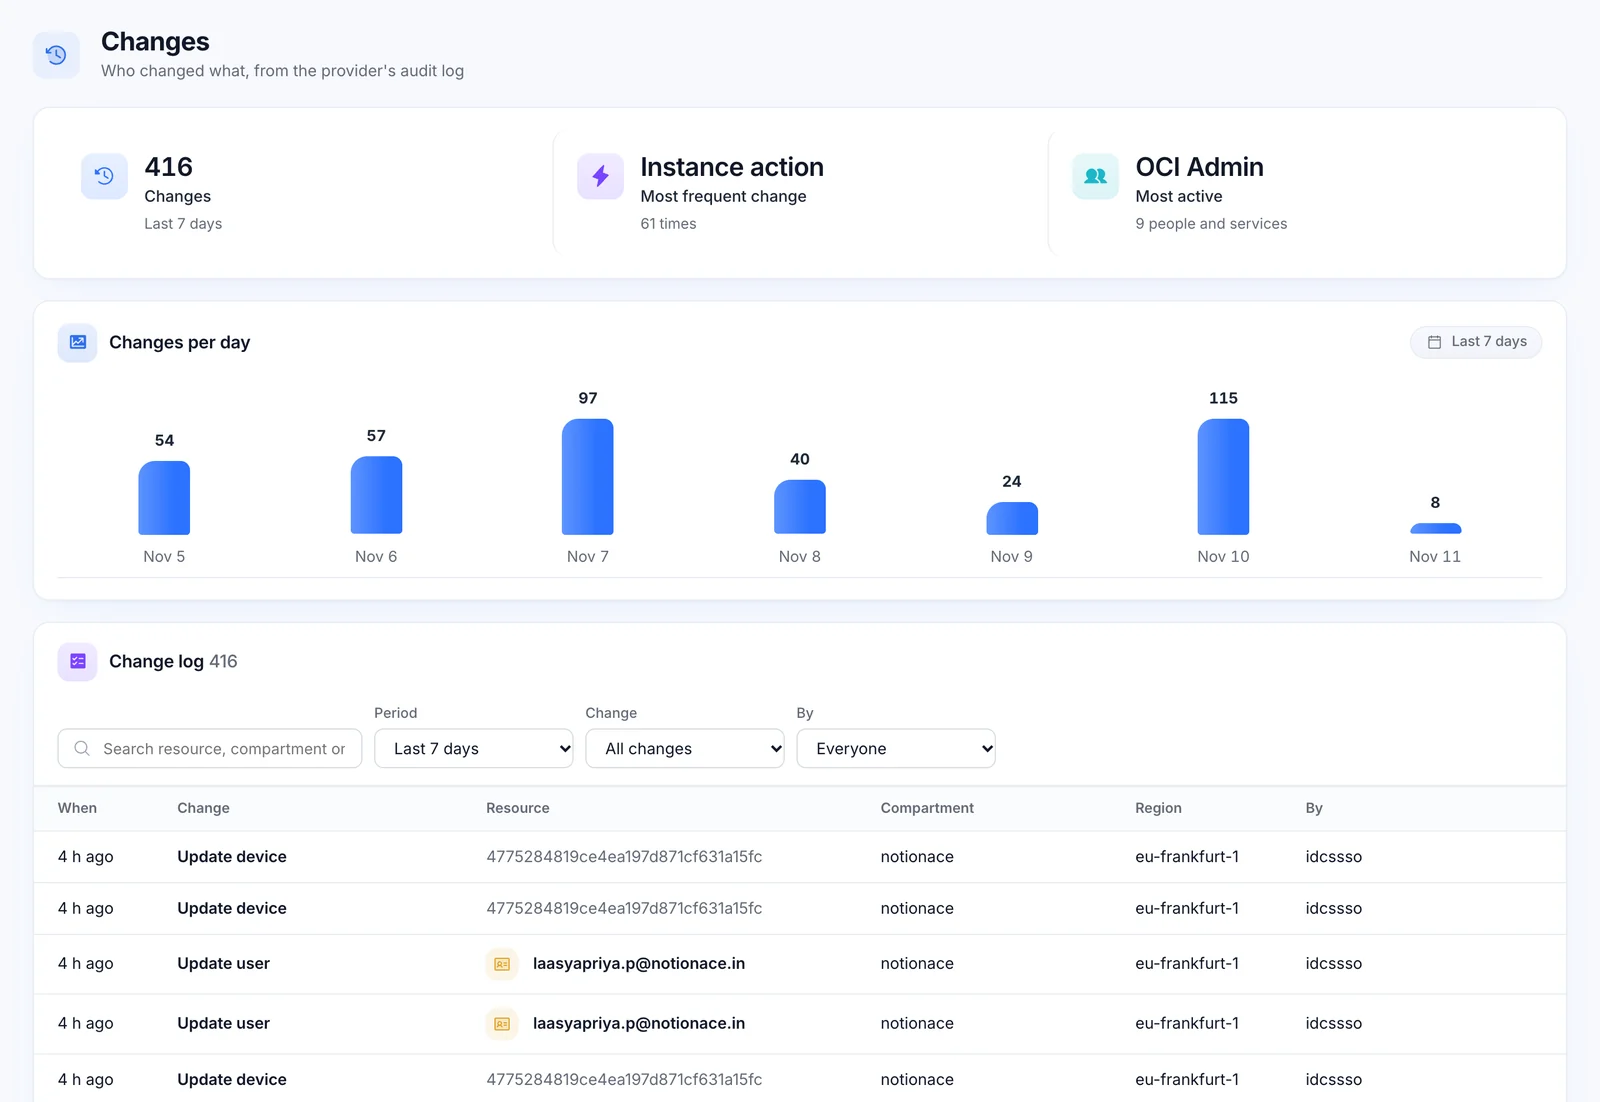
Every cloud change from the audit log, with per-day bars, filters and a link to the resource it touched. VIREOPS filters out its own reads so the history shows only what people and services did.
- Changes per resource on its Asset 360 page
- A Change report for operations reviews, over 7, 30 or 90 days
Load now, and the SQL behind it
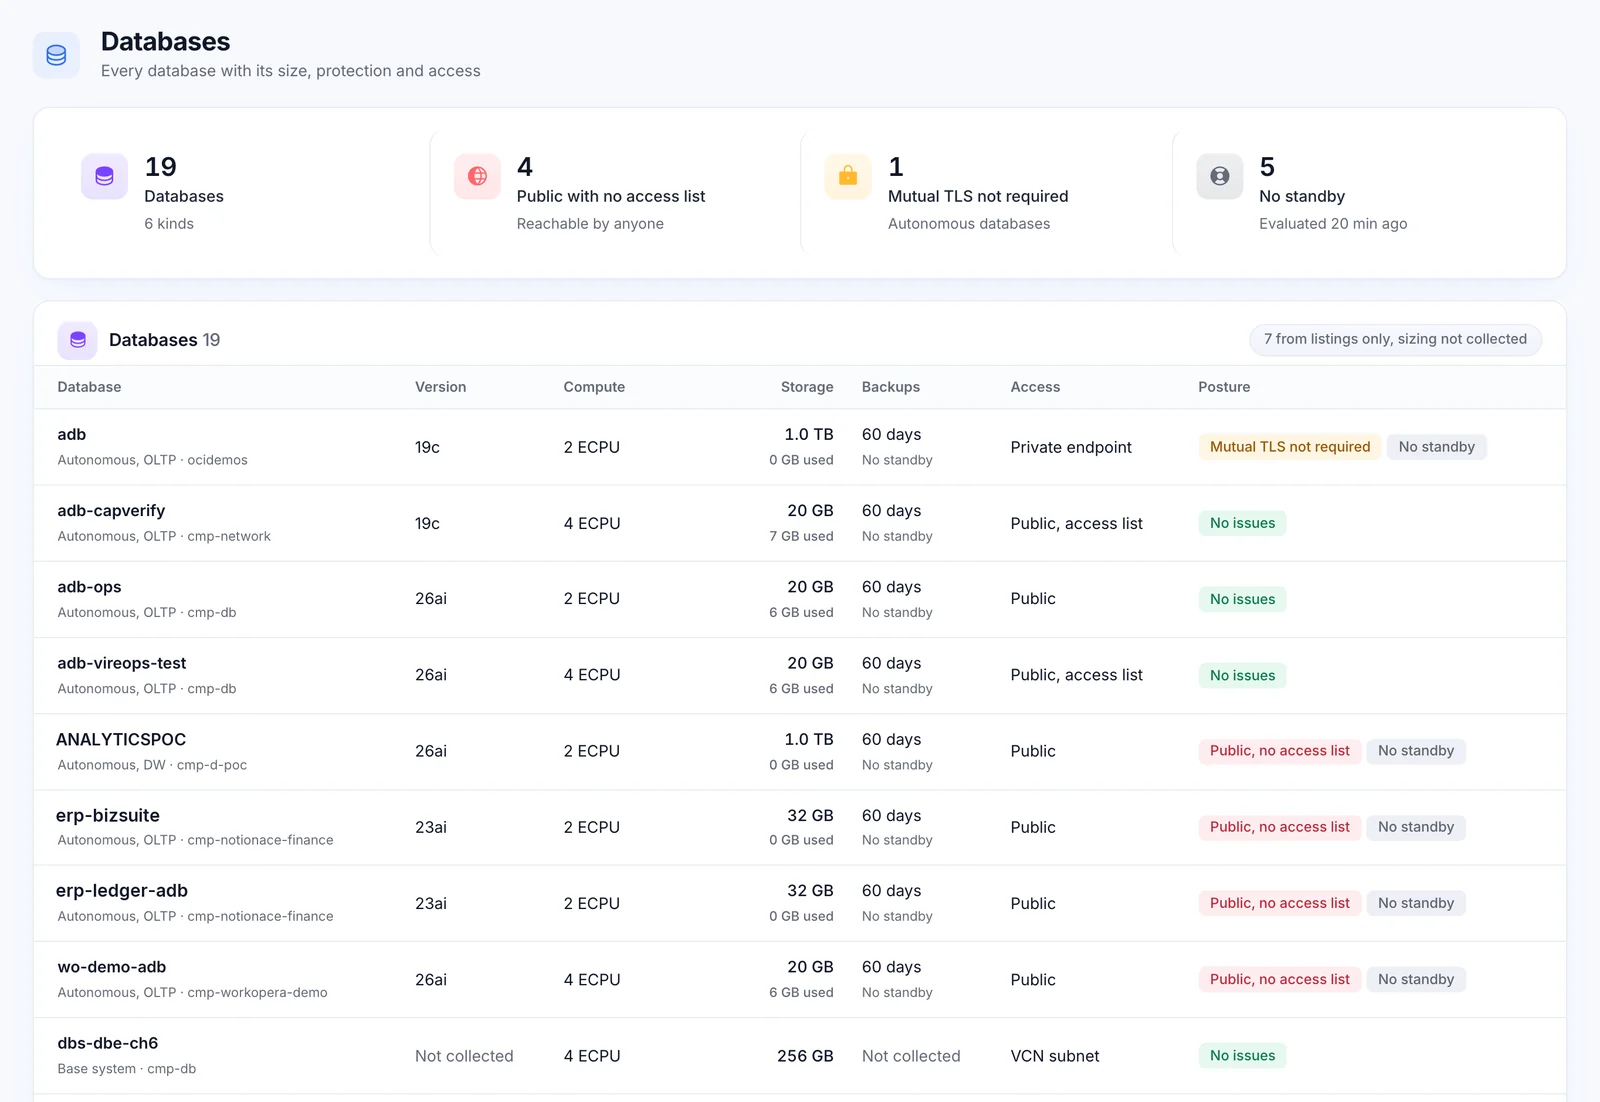
Every database with its version, compute, storage, backups, standby, access and posture flags, plus the newest five-minute values per running database.
- A callout for blocked sessions and failed logons in the last hour
- Top 200 SQL by database time over 7 days from OCI Ops Insights: degrading, inefficient, variable and plan-changing
- Statistics and SQL IDs only, never SQL text. It says plainly when Ops Insights is not enabled
The right people hear first
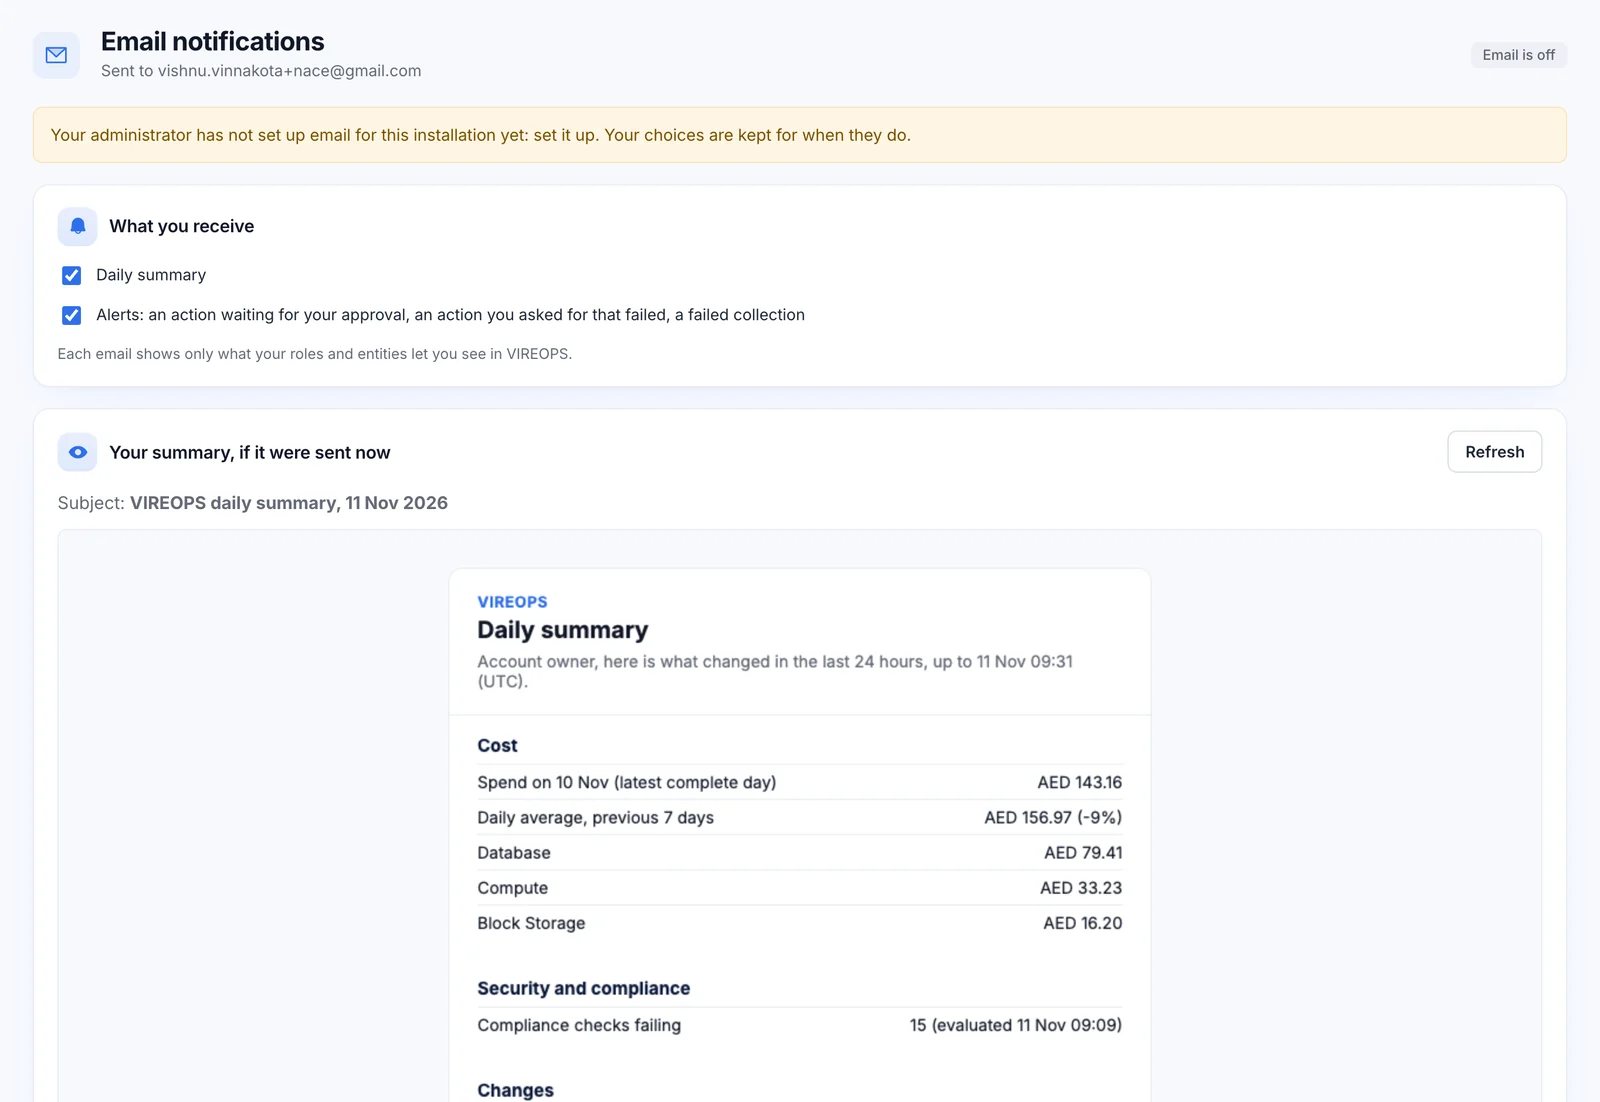
In the console, in the inbox and in your own dashboards. Each person sees only what their roles and entities allow, and a quiet day sends nothing.
- In-app bell Live shows current conditions only: firing alerts and alarms, approvals waiting, failed collections, licence and updates
- Instant email within a minute and a daily summary each morning Built
- Sent from your own mail server: OCI Email Delivery, Microsoft 365 or Amazon SES. Nothing goes through NotionAce
- Your dashboards: live metrics, alerts, failing checks, cost and freshness exported to Prometheus and Grafana
What Monitor collects
All collection is read-only. Anything that is not collected says so, with the reason. Missing data is never treated as zero or "all clear".
| Area | What VIREOPS reads | Status |
|---|---|---|
| Inventory | Every compartment and region via Resource Search, plus DHCP options, Functions apps, dynamic groups and notification subscriptions | Live |
| Collection schedule | Every 1, 3, 6, 12 or 24 hours (default 6), or manual, with a "Collect now" button and live first-collection progress | Live |
| Daily metrics | 14 days of CPU mean and p95 and memory per instance; CPU, storage and sessions per database | Live |
| Live metrics | Every 5 minutes from OCI Monitoring, kept 8 days: instances, Autonomous Database, DB systems, OCI PostgreSQL, volumes, load balancers | Live |
| Changes | The audit log through Logging Search, with VIREOPS's own reads filtered out | Live |
| Alarms | OCI Monitoring alarm states | Live |
| Database performance | Ops Insights CPU and storage trends over 30 days; top 200 SQL by database time over 7 days | Live |
| Network | VCNs, subnets, DRGs, cross-region remote peering, NSG rules (narrow read-only grant) | Live |
| AWS | EC2, EBS, VPC networking, load balancers, RDS, EFS, Lambda, EKS, S3 configuration, CloudWatch CPU, CloudTrail changes, alarms | Built |
| Kubernetes and file systems | OKE workloads and file-system metrics | Not yet |
| Logs | Saved log searches and log-based alerts | Not yet |
Questions about Monitor
Does VIREOPS hit OCI API limits on large estates?
Collection runs on a schedule in the background and the console reads from VIREOPS's own database, not from OCI. A full sweep of about 5,900 resources takes 4 to 5 minutes, and live metrics are read every five minutes between sweeps.
What happens when a resource is deleted or renamed?
A rename keeps the same asset. A deleted resource goes missing, then archived, and can be restored. Nothing is hard-deleted, and its cost history stays available.
Will an alert fire because data stopped arriving?
No. An alert fires only when every point in its window breaches, and missing data never opens or closes one. Failed or partial collections are raised separately in the notifications bell.
Can I see the metrics in Grafana?
Yes. VIREOPS publishes a Prometheus endpoint with live metrics per resource, firing alerts, failing checks, resource counts, the last day's cost and collection freshness. A ready-made Grafana dashboard is not yet included. See the integration.
Does VIREOPS read my SQL or my log contents?
Top SQL uses statistics and SQL IDs only, never SQL text. Log search runs only when a person with the log.read permission searches, results are private to them for 24 hours, and every search is audited.
Let's map your cloud estate together.
See VIREOPS on a live OCI estate: scored, priced and evidenced in one walkthrough. NotionAce deploys it in your tenancy within days.